
What is Big Data?
Big data is a term for data sets that are so large or complex that traditional data processing application software is inadequate to deal with them.
Big Data is being generated at all times. Every digital process and social media exchange produces it. Systems, sensors and mobile devices transmit it. Much of this data is coming to us in an unstructured form, making it extremely difficult to put into structured tables with rows and columns. To extract insights from this complex data, Big Data projects often rely on cutting edge analytics involving data science and machine learning. Computers running sophisticated algorithms can help enhance the veracity of information by sifting through the noise created by Big Data’s massive volume, variety, and velocity.
The “Three Vs” of big data
- Volume
The unprecedented explosion of data means that 90 percent of all the world’s data has been created in the past two years. The global digital universe now exceeds 2.7 zettabytes, and volume is expected to double every two years. Today, the challenge with data volume is not so much storage as it is how to identify relevant data within gigantic data sets and make good use of it. - Velocity
Data is generated at an ever-accelerating pace. Every minute, 571 new websites are created. Email users send 204,166,667 messages. Google receives more than two million search queries. The challenge for data scientists is to find ways to collect, process, and make use of huge amounts of data as it comes in. - Variety
Data comes in different forms. Structured data is that which can be organized neatly within the columns of a database. This type of data is relatively easy to enter, store, query, and analyze. Unstructured data is more difficult to sort and extract value from. Examples of unstructured data include emails, social media posts, word-processing documents; audio, video and photo files; web pages, and more.
Beyond the big three Vs
More recently, big-data practitioners and thought leaders have proposed additional Vs:
- Veracity
This refers to the quality of the collected data. If source data is not correct, analyses will be worthless. As the world moves toward automated decision-making, where computers make choices instead of humans, it becomes imperative that organizations be able to trust the quality of the data.
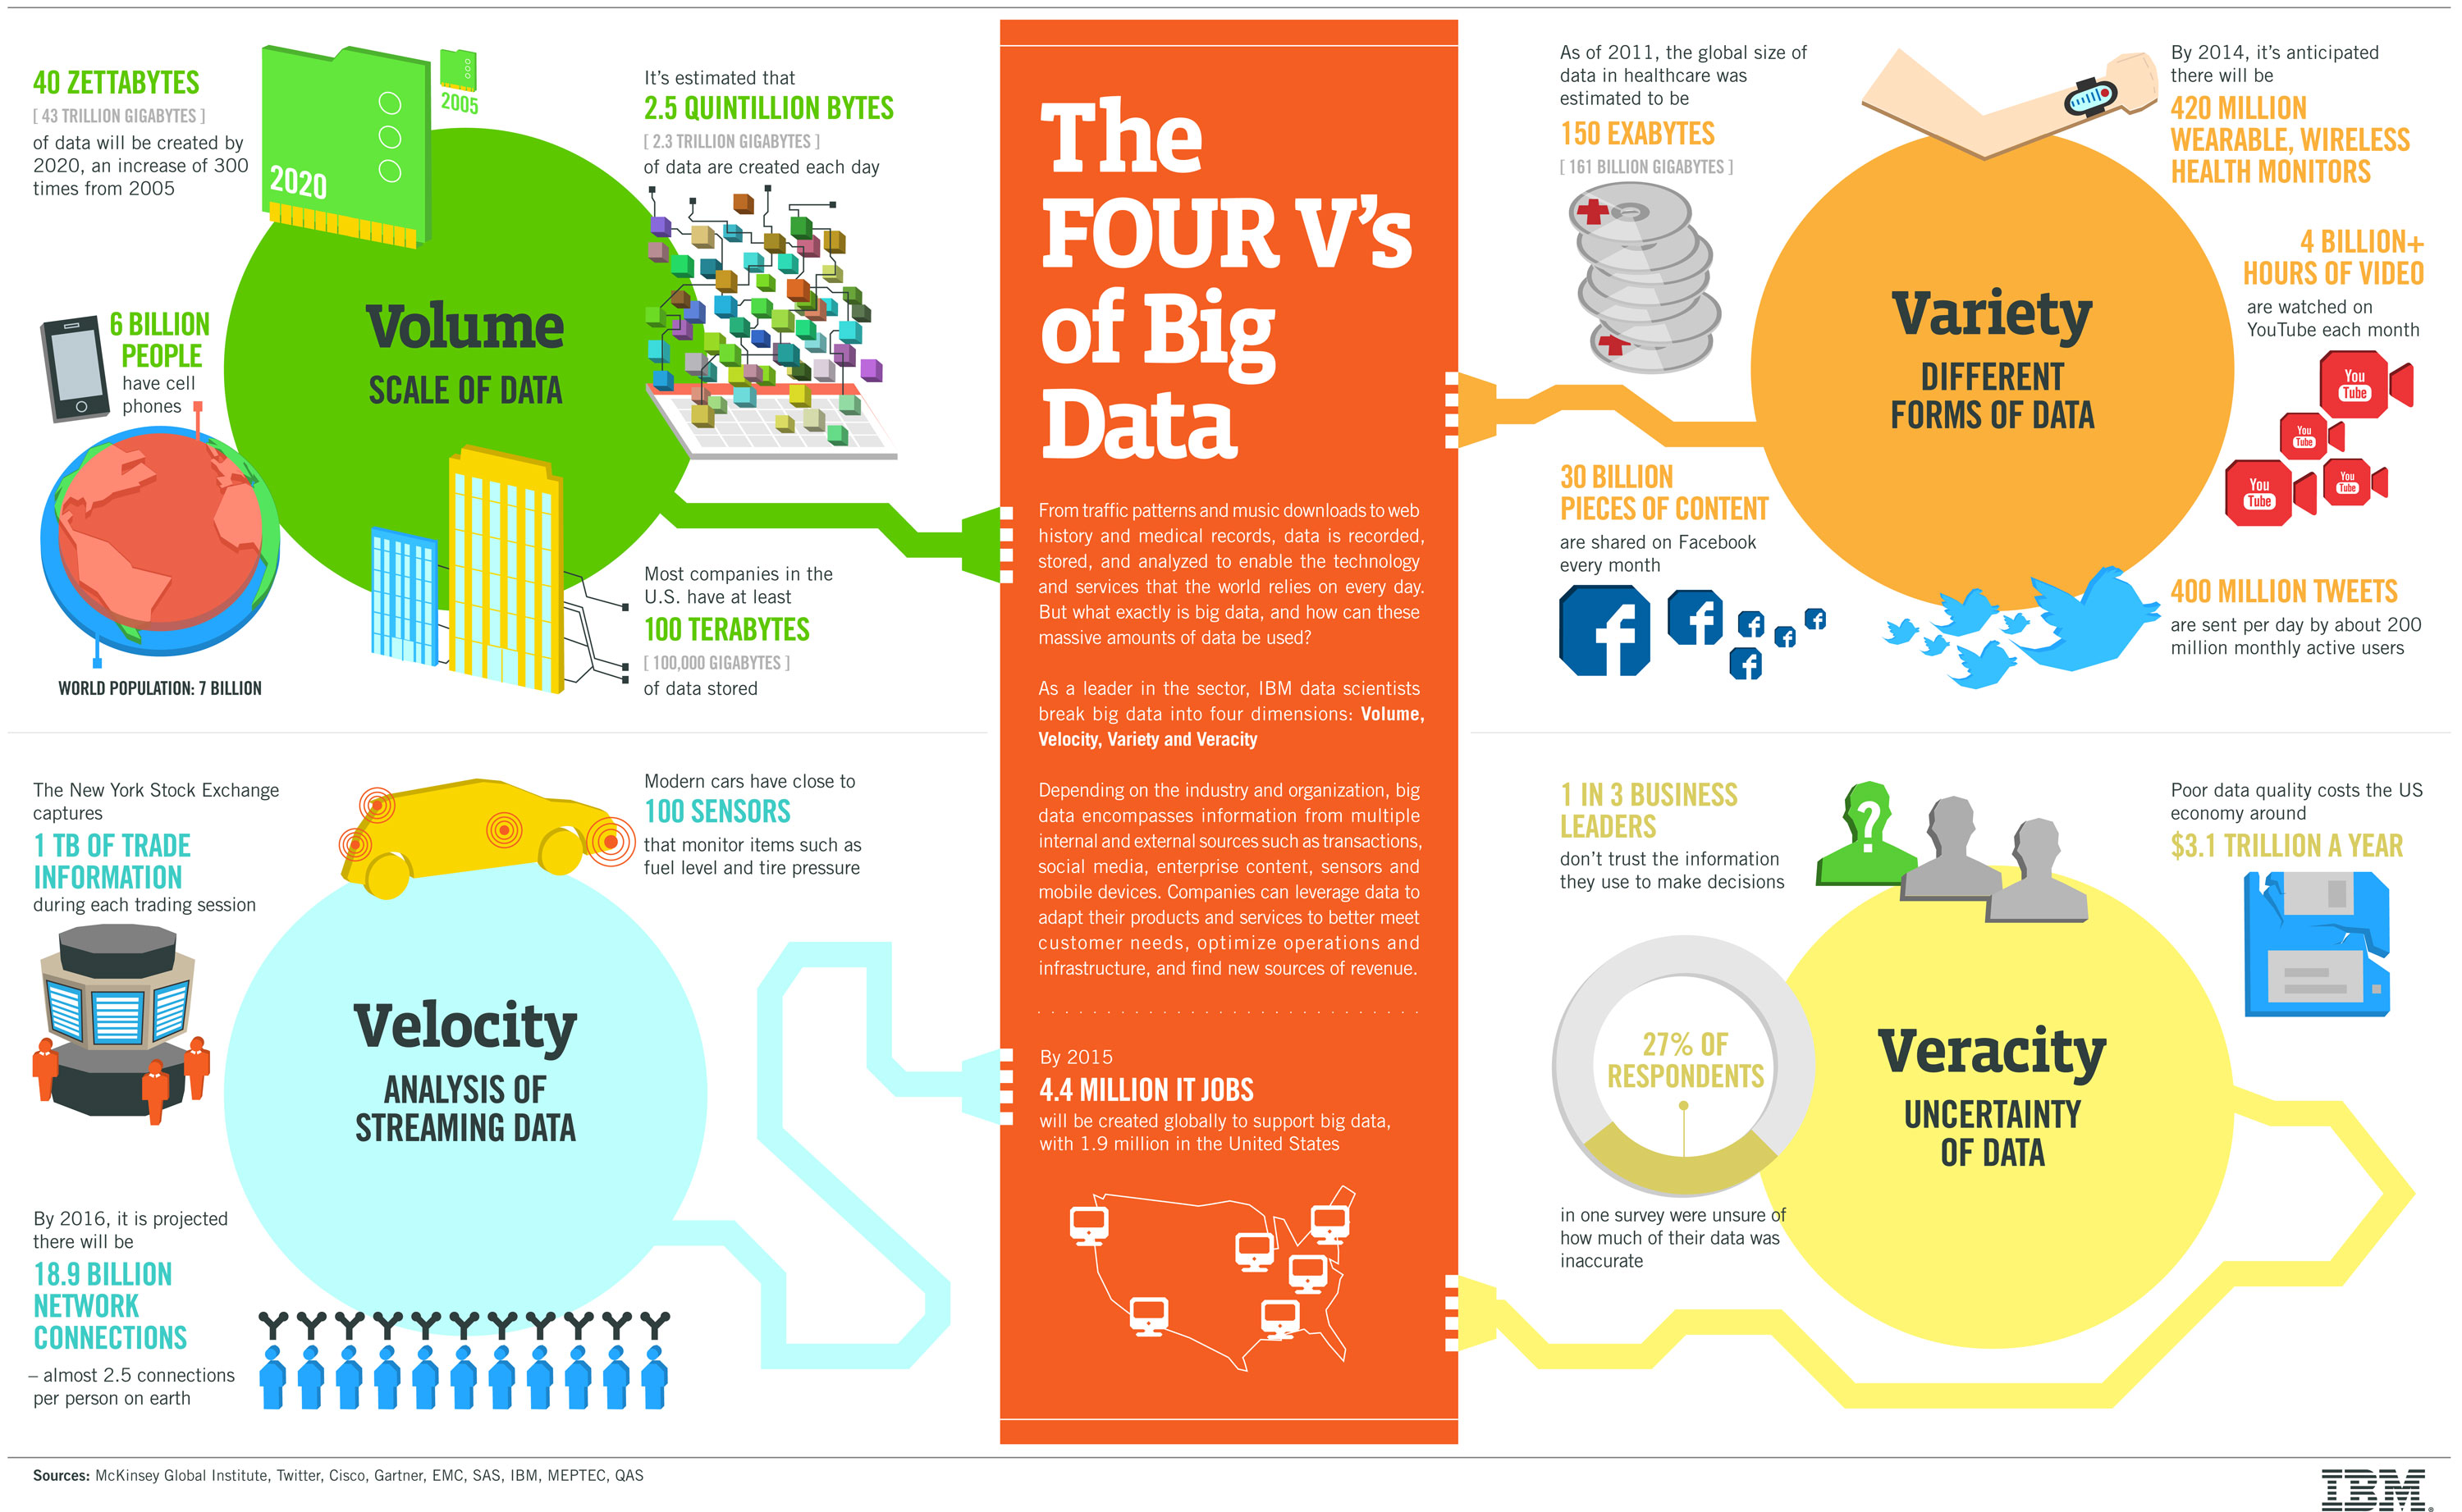
IBM data scientists break big data into four dimensions: volume, variety, velocity and veracity. This infographic explains and gives examples of each.
- Variability
Data’s meaning is constantly changing. For example, language processing by computers is exceedingly difficult because words often have several meanings. Data scientists must account for this variability by creating sophisticated programs that understand context and meaning. - Visualization
Data must be understandable to nontechnical stakeholders and decision makers. Visualization is the creation of complex graphs that tell the data scientist’s story, transforming the data into information, information into insight, insight into knowledge, and knowledge into advantage. - Value
How can organizations make use of big data to improve decision-making? A McKinsey article about the potential impact of big data on health care in the U.S. suggested that big-data initiatives “could account for $300 billion to $450 billion in reduced health-care spending, or 12 to 17 percent of the $2.6 trillion baseline in US health-care costs.” The secrets hidden within big data can be a goldmine of opportunity and savings.
Bringing it all together
No matter how many Vs you prefer in your big data, one thing is sure: Big data is here, and it’s only getting bigger. Every organization needs to understand what big data means to them and what it can help them do. The possibilities really are endless.
Source: IBM.com


Sorry, the comment form is closed at this time.